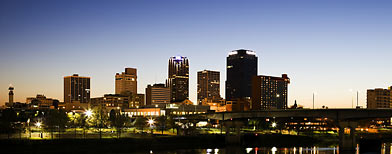
These places scored best for factors like air and water quality in a ranking of the biggest metro areas.
America's Cleanest Cities, 2011
Texas is widely known as a mecca for all things related to fossil fuels, but here's a surprise: It's also home to the cleanest town in the country. That's right. The McAllen-Edinburg-Mission, Texas, Metropolitan Statistical Area (MSA) ranks tops in our list of the America's Cleanest Cities.
The Cleanest Cities list is a healthy offshoot of the Most Toxic Cities list we released last month. In that ignominious ranking Philadelphia comes out on top, followed by New York City and its surrounding suburbs, and four California metros.

So many readers told us they wanted to know which cities fared the best in terms of low toxicity that we decided to put together a ranking of America's 10 Cleanest (as in environmentally healthy) Cities.
What got the McAllen-Edinburg-Mission MSA on the list? A lack of Superfund sites, respectable air quality and a meager amount of toxic substances generated and disposed of by local facilities.
Behind the Numbers
The Environmental Protection Agency (EPA) defines toxic substances as "chemicals or compounds that may present an unreasonable threat to human health and the environment." In terms of toxicity, the EPA's goal is to "identify and reduce the risks from toxic substances," collecting a plethora of toxicity-related data as it relates to land, water and air.
For our Cleanest and Least Cleanest Cities lists, we started with the 80 largest MSAs for which toxicity data is available. These include namesake cities as well as the counties neighboring them, as defined by the U.S. government's Office of Management and Budget. We then ranked these geographic areas based on five equally weighted measures of pollution and toxicity.
For two of our measures we used data directly from the EPA: the Air Quality Index and the Toxic Release Inventory (TRI); the most current data available is for 2009. The AQI clocks the number of days air quality in each of these metros rose above 100 on an EPA index. (At 150, the EPA deems air pollutant levels unhealthy for everyone exposed). California cities on our Most Toxic list, including Riverside and Fresno, clocked 43 and 26 days above unhealthy levels, respectively. In contrast, all the cities on our Cleanest list were totally free from days above the unhealthy limit, except for Las Vegas at No.5.
The TRI presents the number of toxic substance pounds "released," or produced, managed and disposed of in each MSA per year, as reported by the facilities generating them. While the TRI does not in any way indicate these substances find their way into the environment or threaten exposure to humans residing in the area, it does reflect the sheer amount of toxic activity taking place. (You can find more about the TRI here.)
Nearly all the metros on this list logged fewer than 2 million pounds of on-site toxic releases in 2009. McAllen logged an astoundingly low number of releases compared with every other city we evaluated: a mere 446 pounds. (To put this number in perspective, the next lowest city wasOxnard, Calif., with 24,407 pounds.)
We then utilized data from Sperling's Best Places, an online research site that compiles health and living quality indexes for cities and towns across the country. We looked at Sperling's Health Index for each metro's water quality and air quality ratings. We also accounted for Superfund sites, which the EPA defines as "uncontrolled or abandoned places where hazardous waste is located, possibly affecting local ecosystems or people." Sperling's factors in both the number of active sites and the amount of cleanup funding they're receiving in its Superfund assessment.
McAllen and its Plains-Gulf, Texas, neighbors tout the best Superfund ranking on our list. A search through the EPA's National Priorities List for region 6, where Texas superfund sites are inventoried, indicates that the small metropolis has no active sites undergoing or in need of cleanup. Since tens of thousands of sites plague communities across the country, zero is impressive.
Scranton, Pa., ranked No. 7 on the Cleanest Cities list, thanks to a relatively low number of on-site toxic releases (300,000 pounds in 2009) and a surprisingly high water quality rating (especially when compared to its Most Toxic Cities list-topping neighbor to the south, Philadelphia, which came in dead last in our water quality data). Its Superfund assessment, however, leaves a bit to be desired, rating 49 out of 100. Lackawanna, a county within the Scranton-Wilkes-Barre MSA, alone has 13 active superfund sites, some of which have historically posed exposure threats to residents, including the Lackawanna Refuse Site.
Many of these sites hark back in some way to the area's mining days. The northern Pennsylvaniametro was a major hub for the coal and steel industries during the 1800s and into the early 20th century. Those companies, for the most part, have moved their mining elsewhere, leaving behind contaminated sites. But the government--and in some cases the communities themselves--has been steadily cleaning them up for the past several decades.
You may not live in one of these metropolitan paradises for environmental health, but that doesn't that mean you should pack your bags and relocate. The good news is that most U.S. cities have implemented initiatives to clean up their acts.
Every metro struggles with pollution in some form--even the least toxic ones. For example, whileBradenton, Fla., ranked No. 8 thanks to decent air quality and stellar Superfund ratings, water quality is abysmal (36 out of the ideal 100). In Bradenton, like most cities, residents might consider using a filter for tap water.
Many places struggle with air quality too. According to our data, Wichita, Kan., took No. 10 on our list thanks to great air quality. But cities like Las Vegas, Nev. (No. 5), Raleigh, N.C. (No. 3), andLittle Rock, Ark. (No.2), show room for air quality improvement.
Here are the Five Cleanest Cities in America:
 |
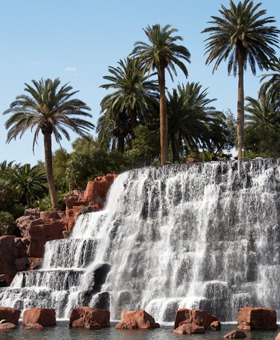
| No. 5: Las Vegas, NV Photo: Thinkstock |
No. 5: Las Vegas, Nev.
Metropolitan Statistical Area (MSA): Las Vegas-Paradise, Nev.
Air quality rank: 40
Water quality rank: 12
Superfund rank: 7
Pounds of on-site toxic releases (2009): 1.3 million
Metropolitan Statistical Area (MSA): Las Vegas-Paradise, Nev.
Air quality rank: 40
Water quality rank: 12
Superfund rank: 7
Pounds of on-site toxic releases (2009): 1.3 million
 |
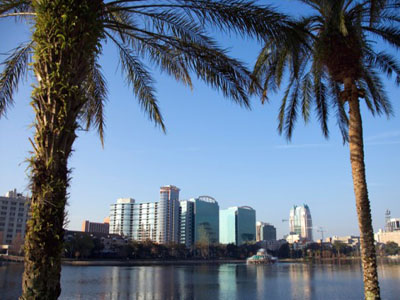
| No. 4: Orlando, FL Photo: Thinkstock |
No. 4: Orlando, Fla.
MSA: Orlando-Kissimmee, Fla.
Air quality rank: 15
Water quality rank: 16
Superfund rank: 19
Pounds of on-site toxic releases (2009): 1.6 million
MSA: Orlando-Kissimmee, Fla.
Air quality rank: 15
Water quality rank: 16
Superfund rank: 19
Pounds of on-site toxic releases (2009): 1.6 million
 |
| No. 3: Raleigh, NC Photo: GRCVB/visitRaleigh.com |
No. 3: Raleigh, N.C.
MSA: Raleigh-Cary, N.C.
Air quality rank: 41
Water quality rank: 1
Superfund rank: 24
Pounds of on-site toxic releases (2009): 492,000
MSA: Raleigh-Cary, N.C.
Air quality rank: 41
Water quality rank: 1
Superfund rank: 24
Pounds of on-site toxic releases (2009): 492,000
 |
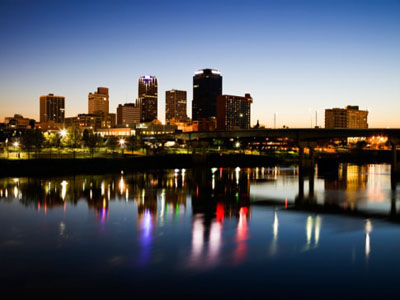
| No. 2: Little Rock, AR Photo: Thinkstock |
No. 2: Little Rock, Ark.
MSA: Little Rock-North Little Rock-Conway, Ark.
Air quality rank: 31
Water quality rank: 2
Superfund rank: 11
Pounds of on-site toxic releases (2009): 439,000
MSA: Little Rock-North Little Rock-Conway, Ark.
Air quality rank: 31
Water quality rank: 2
Superfund rank: 11
Pounds of on-site toxic releases (2009): 439,000
 |
| No. 1: McAllen, TX Photo: City of McAllen, Texas |
No. 1: McAllen, Texas
MSA: McAllen-Edinburg-Mission, Texas
Air quality rank: 5
Water quality rank: 19
Superfund rank: 1
Pounds of on-site toxic releases (2009): 446 pounds
MSA: McAllen-Edinburg-Mission, Texas
Air quality rank: 5
Water quality rank: 19
Superfund rank: 1
Pounds of on-site toxic releases (2009): 446 pounds
0 comments:
Post a Comment